(Originally posted on The Otter, Jan 10, 2013)
Forty years ago, on Christmas Eve 1972, NASA released a gift to the public, the “Blue Marble” image of the whole Earth from space. This photograph was unplanned and originally unwanted by NASA, but it quickly became one of the most reproduced images on Earth.[1]
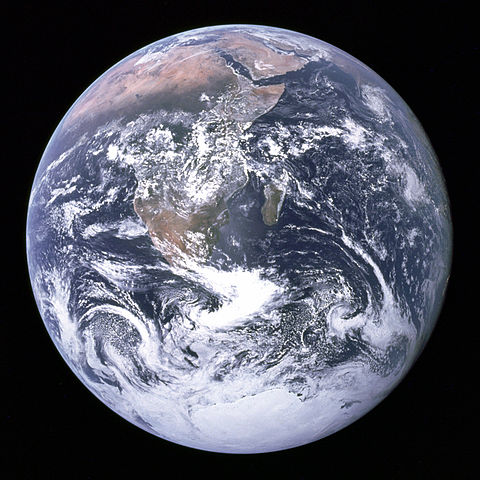
The astronauts aboard Apollo 17 were the first humans to find themselves in that sweet spot between the earth and the sun that offers a full view of the planet. It was an unprecedented photo op at 28,000 miles, and it has never occurred since. Other photos and compilations were made of Earth from space, but there is something about the clarity, colour, and serendipity of this photograph that sets it apart. It became the iconic image of the environmentalist movement and the epitome of remote sensing in the twentieth century.
In part three of our series on practical Geographic Information Systems (GIS) guides for historians we look at air photos and remote sensing. Remote sensing is the observation of any phenomenon from a distance, or a study made without handling the subject. In a way, all historians practice it. In geospatial terms, remote sensing is the analysis of geographic data captured from the air or space.
We have always been capable of imagining the landscape from above. One of the earliest maps is an oblique aerial view of the Paleolithic town Catalhoyuk, and bird’s eye views of cities became popular in early modern Europe. Of course these were stylized maps and not actually based on remote sensing. But there is a universal desire to see the world from above, or at least to understand the things we can’t reach. Some of the first Canadian maps created from remote sensing data were navigational charts of coasts and river bottoms. In the late nineteenth century, photogrammetry was used for mapping, especially in mountain terrain. Almost as soon as humans took to the air and to space, aerial and satellite photography blanketed the globe and transformed twentieth century cartography.
In this post we deal mostly with aerial photographs, although recent work has also been done on using satellite imagery in historical research.
What can historians do with historical air photos?
In Nature’s Economy, Donald Worster wrote about the historical impact of seeing the planet’s “thin film of life” in the Blue Marble photograph.[2] The earth we touch, taste, and consume seems universal and unlimited, but sensing the planet from above reveals limits and interdependent systems. From 28,000 miles we are fragile, unique, and alone.
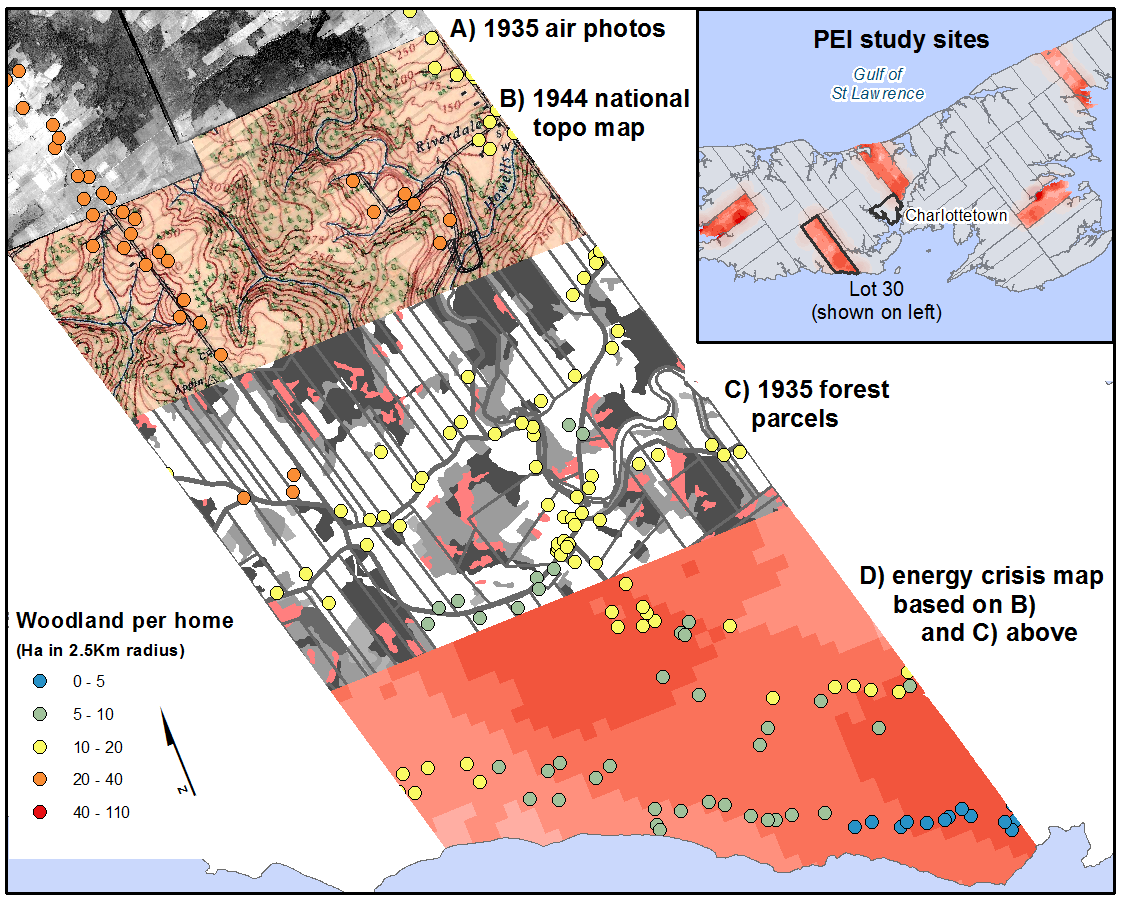
Most historians will be interested in historical images taken a little closer to Earth; there are many and they have many uses. Good historical land use data matters, and remote sensing is one of the historian’s and historical geographer’s primary documents for understanding environmental change.
Air photos are also commonly used as supplements to other historical research. For instance, a 1958 air photo of a small island in Prince Edward Island National Park, shows that the island had quite recently been connected to the mainland by a causeway. A later image of the same landscape showed that the island eroded more quickly as a result. By comparing the three images (before, during, and after 1958) in a GIS, historians can measure the precise rate of erosion before and after the construction of the causeway. Thus, air photos contain information about place, single events that occurred in that place, and more gradual trends such as coastline change. All of this is possible with three photos.

Aerial photo of Robinsons Island, PEI 1935

Aerial photo of Robinsons Island, PEI 1958

Aerial photo of Robinsons Island (west end), 1974
What do you need to get started?
First you’ll need some air photos of your area of interest. There are two main forms of aerial photographs, vertical and oblique. Vertical photos are taken at a 90-degree angle and oblique at something closer to 45 degrees. Both forms were used for surveying and mapping. Vertical photos offered a less distorted image of the terrain, and these became standard practice in the inter-war period.
The good news is that Canada was a leader in aerial photography, so its collections date back to the 1920s and it has a lot of them – a lot, as in over 6 million. That’s also the bad news. Locating the air photos for the right time and the right place for your research can be daunting. Most of these documents can be found at the National Air Photo Library (NAPL), but localized collections also exist in government offices, university libraries, and some museums.
Managing the collection will also take some planning; the earliest air photos were taken at a scale of about 1:15,000 (one 9 inch photo represents over 2 miles of terrain) and overlapped, so a single Prairie township occupied up to 50 photos. A GIS is an excellent tool for displaying, managing, and eventually analyzing the images. If you plan to incorporate air photos into a GIS, be aware that large numbers of high resolution images will take up a lot of processing power.
Fortunately, most air photo collections are labeled and well organized, and in some cases they are searchable using a map index. The Canadian National Air Photo Library’s catalogue is available at NAPL Online. This search engine is a bit tricky to get used to (see search tips), but once you’ve identified your research area on the map, it allows you to display the approximate location and outlines for each air photo. Many of NAPL’s images have already been digitized, and the engine will show low-resolution previews of any digitized photo. From there you will have to record the call numbers and request copies from the library, at a cost.
Other providers offer historical imagery for free, such as the Government of Prince Edward Island, although getting the highest resolution may still require ordering originals from NAPL. See the working list of aerial photo collections in Canadian university, provincial, and municipal archives, at the end of this post.
What programs do you need to view air photos?
This depends on what file format the digitized photos came in and what you want to do with them. There are three main types of digitized air photos, and GIS users group them under “raster” based data.
The first and most common is a 2-dimensional raster image (for example .jpg) without geographic coordinates. These images are no different than a photo of your friends on Facebook. They can be opened in any browser or image preview software, and they are easy to explore. However, since they lack geographic coordinates, you could not incorporate them into a GIS and have them line up with other features. In order to do this you must either “georeference” or “orthorectify” the image which converts it into the second and third raster type.
Georeferenced air photos are the same as the 2-dimensional images, except they have been given geographic coordinates and made to fit the 3-dimensional curve of the earth. They are then saved as a new file format (for example TIFF and GeoTIFF are non-proprietary formats that will open in a variety of GIS programs). We will explain how to assign control points and georeference images in another guide, because it applies to any historical map or image that you might want to incorporate into your GIS. However, unlike maps, air photos are images captured with a lens, and like all photographs they contain distortions. Distances and shapes become distorted as features move away from the centre of the image toward the edges. If geographic precision and accurate measurements are important to your research then you need to consider the third format, orthoimages.
Orthorectified images, often just called “orthos,” are 2-dimensional images that have been given both geographic coordinates and geometric correction to account for the curvature of the earth and distortion in the images. Most GIS software will orthorectify air photos, but it requires more than just control points. Information on the altitude, lens type, and angle of the camera are required for each photo. This was usually recorded in flight logs, but in very early air photos it might not be possible to ascertain. Again, if your main interest is in observing features in the landscape or general land use over time, orthorectification is not required.
Georeferenced and orthorectified images are most commonly saved in GeoTiff (.tif) format, and these are easily opened by GIS programs such as Quantum GIS, ArcGIS, and MapInfo. Other formats include MrSID, an early raster format popular among GIS users, and more recently KMZ (a zipped Keyhole Markup Language format). Images stored as KMZ open in Google Earth and allow quick and easy overlays and measurement.
Go ahead, try it!
The University of Waterloo Map Library has an excellent collection of aerial photos from the Waterloo Region and beyond. To explore their collection of digitized air photos you can navigate through the Air Photos Digitization Project. Once you’ve found an area you would like to open in a GIS or Google Earth you can choose a file format and download it. For example, try downloadingthe KMZ in this section of rural Woolwich township (as they instruct, remove .zip from the filename after downloading) and open it in Google Earth. You will be able to zoom in and out, tilt for a 3D effect, and add layers from Google’s collection.
The Waterloo example is one of the best in Canada at the moment, but as you will see from the list below, almost every Canadian centre has an air photo collection. Go ahead and explore, and if you find some images of the world you know from above, you might want to contact the library and the other guides in this series for help.
Josh MacFadyen is a Postdoctoral Fellow at the University of Western Ontario and the Project Coordinator for NiCHE.
[1] Donald J. Wuebbles, “Celebrating the ‘Blue Marble,’” Eos 93(49) (4 December 2012); 509-510; Robert Poole, Earthrise: How Man First Saw the Earth (New Haven: Yale University Press, 2008); Al Reinert, “The Blue Marble shot: Our first complete photograph of Earth,” Atlantic, 12 April, 2011. [Available at http://www.theatlantic.com/technology/archive/2011/04/the-blue-marble-shot-our-first-complete-photograph-of-earth/237167/]
[2] Donald Worster, Nature’s Economy: A History of Ecological Ideas (Cambridge: Cambridge University Press, 1977), 358-9.
Federal air photo and remote sensing holdings
University air photo holdings
- Bishop’s University, Eastern Townships Research Centre
- Brock University Map Library
- Carleton Library (includes Northern Communities Collection)
- McGill Library
- McMaster University, Lloyd Reeds Map Collection
- Memorial University Libraries Map Room
- Queen’s University Library
- SUNY Buffalo (Collection with Canadian images)
- University of Alberta Library
- University of British Columbia, Geography
- University of Calgary, Map Library
- University of Saskatchewan, Historical GIS Lab
- University of Toronto Map and Data Library
- University of Toronto, Mississauga
- University of Victoria Map Library
- University of Waterloo Library Geospatial Centre
- University of Western Ontario Map Library
- University of Winnipeg, Geography
- York University Map Library
NB: Since writing this post, it also came to my attention that York has an extensive collection of low-level oblique aerial photographs of conservation areas in Ontario taken by Lou Wise.
Other library and archival collections
- Aerial Views in “Our Ontario”
- Archives of Ontario, Aerial Forestry Photos
- Bibliothèque et Archives nationales du Québec, Cartographic Archives
- Prince Edward Island, Public Archives and Records Office
Provincial holdings
- Alberta, Sustainable Resource Development
- British Columbia, GeoBC
- Manitoba, Manitoba Land Initiative and Air Photo Library
- New Brunswick, Service New Brunswick
- Newfoundland and Labrador, Surveys and Mapping Division
- Nova Scotia, Nova Scotia Geomatics Centre
- Nova Scotia, Service Nova Scotia
- Prince Edward Island
- Quebec, Ressources naturelles
- Saskatchewan, Information Services Corporation
Municipal holdings
- City of Toronto Archives
- The University of Waterloo Library has compiled a list of all the Canadian municipal governments that provide open GIS data online. The municipalities offering air photos include Fredericton, Nanaimo, North Okanagan, North Vancouver, Surrey, and Vancouver.
Many other municipalities provide limited historical air photos for viewing only, such as London,Red Deer, the Region of Waterloo, and many more in this list identified by the University of Waterloo Map Library.
Global datasets of interest
Scotland!