Living for two months with six people, no furniture, and only what cargo we could cram into a small white minivan is strangely illuminating. That’s what I did this summer. I moved my family from Saskatchewan to Arizona, and I found the process of inhabiting mainly empty spaces a unique way of understanding priorities and place in our digital world. For the first month our goods and chattels were packed and stored while I waited for the gears of US immigration to turn and release my paperwork. For the second month those boxes languished at the border while I began my new position at Arizona State University. It was a bit like camping in houses.
It was illuminating for two reasons. First, it showed how low most of our stuff is on the new hierarchy of needs. WiFi routers are surprisingly high, and cell phones are just behind that. Small things make a big difference, and they reflect different priorities. Coffee makers and kitchenware are more valuable per cubic inch than shoes. You would trade your family heirloom bookcase for a pillow in a heartbeat. Nine-year-old boys will choose a WiiU over underwear. Every time. And geography matters. In Arizona, air conditioners are paramount, but hot water is unnecessary in the summer months. (I was taking “cold” showers for a few days before I realized that the cold water here is only slightly cooler than the hot.)
But moving so far and so often in the last 3-4 years has also reminded me that places and people come with you, and they travel more easily now than ever. Thanks to the various digital networks we build around us – from blogs to social media to networks like NiCHE – we don’t easily unsubscribe from place.
As routinely as we update our bills and addresses we peripatetic academics unsubscribe from department and other email lists soon after we move to a new town. Maybe me more than most. But we are less likely to unfollow old friends on twitter and social media. Twitter is really about place; my feeds are often about the people and groups at the places I love. The places I’ve left behind.
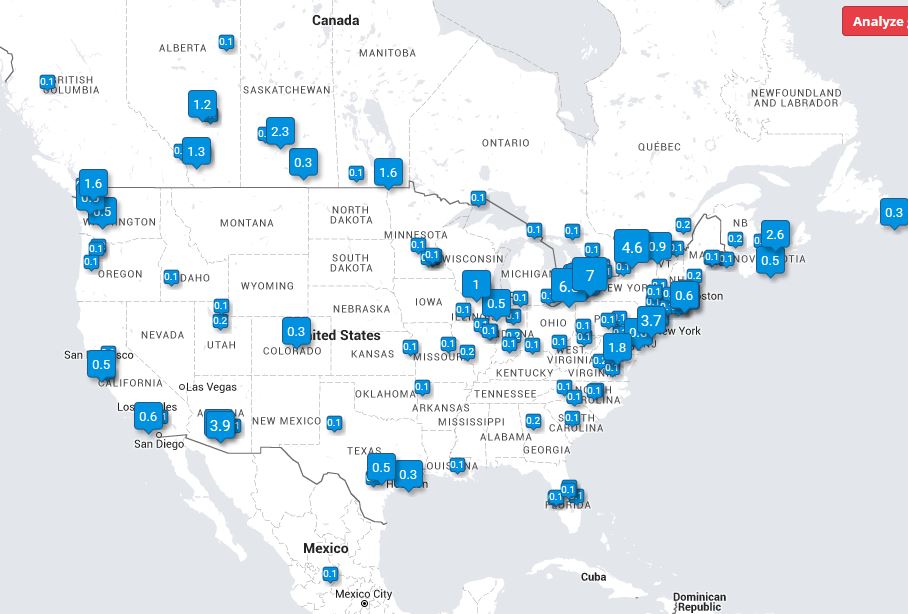
Twitter users followed by @joshmacfadyen (% by City) TweepsMap, Oct 2015
I still get emails from political parties seeking support in many of my former ridings, and I feel like I know more about those ridings than the ones where I cast my vote. Thanks to Twitter I know what local organizations are doing in Charlottetown, London, and Saskatoon just as frequently as I do in Arizona. The first place I go to find out if Canadians are celebrating or hating the Blue Jays is Twitter and Facebook.
Immigration historians will be the first to tell me that these digital networks aren’t exactly new. Emigrant letters and diaries are a fascinating resource for studying the mobile nineteenth century society. Even as a child, in 1980s Prince Edward Island, I remember my parents receiving steady mail from distant relatives who had long emigrated to Boston and other parts of New England. The part that captured my attention was the newspaper clippings and comics my Great Aunt Ruby would send us – surely the twentieth century equivalent of posting a cartoon to someone’s wall.
Other Prince Edward Island expatriates have waxed eloquent on their home province since the first rush of outmigration began in the late nineteenth century. One medium for their network was The Maple Leaf, a magazine launched in California in February 1907. The editor, Michael Ambrose McInnis, emigrated in 1889 and established a printing business in Oakland. The magazine operated until 1947, providing news and opportunities to generations of Martimers living in the United States during a period of steady outmigration. Aunt Ruby and Mike McInnis hadn’t unsubscribed from place either.
One key difference between The Maple Leaf and my digital networks is the absence of an editor like McInnis – although arguably they’re all still controlled by men living in California. For the most part I edit my networks, and my connection to place, both consciously and unconsciously. My networks are currently dominated, of course, by Canadians or at least people who care about Canada. As my local Arizonan networks grow they are displacing some of the northern content and creating no end of fascinating juxtapositions – climatological, political, cultural.
The TweepsMap of people I follow on Twitter suggests that my digital network is centered in the Northeast, and particularly in Ontario, Maritime, and Atlantic Seaboard cities (see above). However, I was surprised to see that the second largest state or province (after Ontario’s massive 26%) was Arizona. This state is already home to 7% of the people I follow.
As a Canadian in Arizona I’m keen to maintain some knowledge of current events as well as the research communities in the north, and these networks have been a useful way to do both. I’m happy to keep my subscription to place and to Canadiana. I may even start sending newspaper clippings to my nieces and nephews.
The 2013 ice storm left hundreds of thousands of Canadians out in the cold and made some people pause to consider the fragility of urban energy systems in a changing climate. The idea of so many people spending Christmas in the cold made me reflect on some of the better-known cases of Canadians freezing to death in the past. Frankly – and aside from Sir Franklin – most of us likely couldn’t name a single person who died in this way. But one name we should all know is Neil Stonechild. His story, and the stories of other victims of hypothermia, should shape how we think about systemic racism and other social injustice.
Neil Stonechild (1973-1990), Saskatoon, SK undated photo
This month marked the 10th anniversary of the inquiry that brought a police force, an entire city, and many parts of Canada to consider some of these problems. The body of 17-year-old Neil Stonechild was found in an industrial area at the northern edge of Saskatoon in November 1990. He had frozen to death in that position five days earlier, wearing light clothing and only one shoe. His face was bruised his blood alcohol content had been high, and some of his friends and family suspected foul play. They were told that a full investigation had been conducted and that the teen had wandered to this remote location under his own volition. A cold case if ever there was one.
Still, some wondered if Neil had been the victim of a “starlight tour,” or the un-authorized police practice of leaving drunk or rowdy people on the outskirts of the city to dry out. Some could survive the walk, but in the case of Stonechild and several other Cree men, drying out in a Saskatchewan winter meant freezing to death. Prairie winters are unforgiving, to put it mildly. Saskatoon’s average January temperature (from 1977 to 2012) consists of daily lows “around -20°C, falling below -33°C or exceeding -8°C only one day in ten.” On the night Stonechild went missing, the temperature fell to -28°C.
Ten years later Darryl Night told a police officer that he had been left in a field one January evening, and he only survived the -20°C temperatures because he found his way to a power station and called a taxi. Night did not expect anyone to believe him. But days later the frozen bodies of two other Aboriginal men were found in a similar location and the police officer consulted Night and asked him for a full report. This began a long process of investigation and reconciliation that reopened the Stonechild case and culminated in a Commission of Inquiry and a report revealing what really happened to Neil Stonechild. The police officers were charged with a minor offence and relieved from their duties. The police chief was replaced, and a series of recommendations were advanced to build better accountability and begin repairing the trust between First Nations communities and the police.
The stories have been told extensively in the report, books, articles, and the Two Worlds Colliding NFB documentary below. It includes interviews with captivating characters, and the haunting line from one of the mothers of the men who froze in 2000:
But in many ways Stonechild’s story continues. Some challenge the evidence and testimonies used to charge the two officers. Others claim that starlight tours are continuing under other police forces and lives are at risk. The Saskatoon Star Phoenix ran several excellent features on the Stonechild Effect over the weekend. The actions taken by the Saskatoon Police force have been impressive, considering the profoundly strained relations between First Nations and police forces across Canada.
Still, simple changes in technology and even policy will not eliminate racism. We need to ask why officers would employ a risky, illegal, and reprehensible practice with seemingly little to gain? It was not official police policy, and it was not carried out by most or even many officers. The investigation suggests that it may have occurred in periods when the pressures of policing were building and resources were low. Starlight tours were not mentioned in the Stonechild report, but it suggested that this was an unfortunate, and deadly, way to circumvent safe and legal detention.
Historians will note that the police chief at the time of the Inquiry apologized to the victims and their families with a confession. He claimed that although he was initially unaware of any cases of starlight tours, when he began to investigate he found recorded examples as early as 1976. Theirs was not an isolated case.
We are learning all too frequently of course that the first Aboriginals to perish in the care of the state died long before 1976. The roots of these problems run deep. My own research is in Canadians’ experience with the cold. Even there we see that many of the Aboriginal men who were left in dangerous conditions belonged to a group most likely to suffer hypothermia and neglect. Neil Stonechild was a young man with a face that captured the media, but if had been part of the usual demographic of older victims, his story may never have caught the attention of the public, and thus the police.
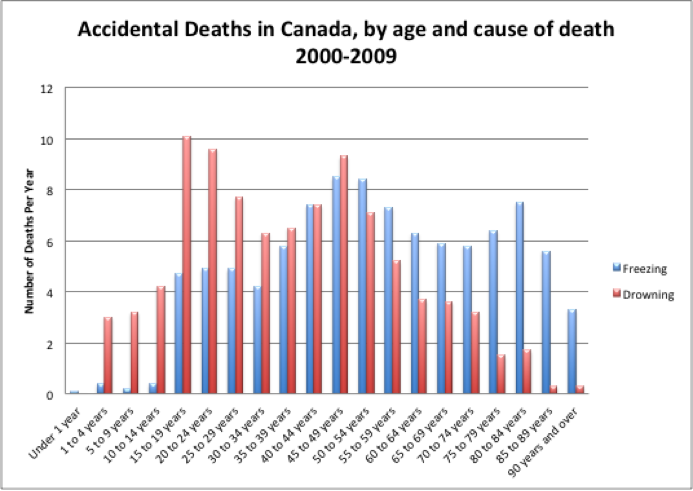
Accidental deaths by drowning and freezing in Canada, by age. Source: Canadian Vital Statistics, Death Database
My article on the ice storm noted that most victims of hypothermia in the twenty-first century are the elderly. When compared to the age range of people who die by drowning, for example, people at risk of exposure to the cold are usually older and poorer. Heat and shelter are in the base layer of Maslov’s hierarchy of needs, and people without access to these basic physiological needs often struggle with poverty and addictions. Like the Aboriginal men and women abandoned on starlight tours, Canadians at risk of hypothermia are very much overlooked and marginalized by large parts of society.
But did people actually freeze in an energy rich country like Canada, and if so under what circumstances? The trend seen in Saskatoon dates back to at least the nineteenth century in Canada. The most commonly reported cases of hypothermia in the age of temperance were also related to poverty and addictions.
Not only did alcohol impair the judgment of someone caught in the cold, but we now know that it expedites some of the heat loss processes that cause death by freezing.[1] Nineteenth century temperance magazines were replete with apocryphal accounts of incorrigible drunkards dying or losing limbs from hypothermia.
The slightly more balanced Globe would occasionally print stories of hypothermia such as the case of Murdoch Martin, a resident of Huron County who “addicted to intemperate habits” was found “lying on the ice, half a mile out on the lake.” The results of autopsy confirmed that “Martin came to his death by taking too much intoxicating liquor, and by exposing himself to the inclemency of the cold weather on the night of February 6th 1868.” The mention of his widow and six children suggest Martin was middle-aged or older.[2]
Not all victims were lost in the rural wilderness, and not all were older. During the particularly cold winter of 1866, the Globe complained that Toronto’s “streets are filled with vagrants during the day, and at night the police stations are besieged with numberless applicants for shelter.” In the middle of this context a 21-year-old woman named Margaret Armstrong was found frozen to death in the yard of Trinity College on Strachan Avenue. She had been recently released from the gaol, where she was “an habitual inmate” and she died through the night, presumably intoxicated.[3]
Official statistics recorded hypothermia with some regularity, but finding the cause of death in the census in the nineteenth century is hardly straightforward. Some may have been included under “alcoholism” or other causes. In 1891 hypothermia was not reported as a cause of death at all, and in 1871 and 1881 it was divided between two ailments: “cold” (Refroidissement in French) and the much smaller category of “frostbite.”
Even when the proper language is identified the veracity of the data remains suspect. Babies were suspiciously prone to death by “cold.” Why would that be? George Emery’s Facts of Life identifies several other problems with early vital statistics, including the inability to self-report one’s own death! James Daschuk’s Clearing the Plains shows the fine line between freezing and starving to death on the Plains, and of course the large numbers of each who were omitted by the Census in the 1870s and 1880s Canadian Territories.
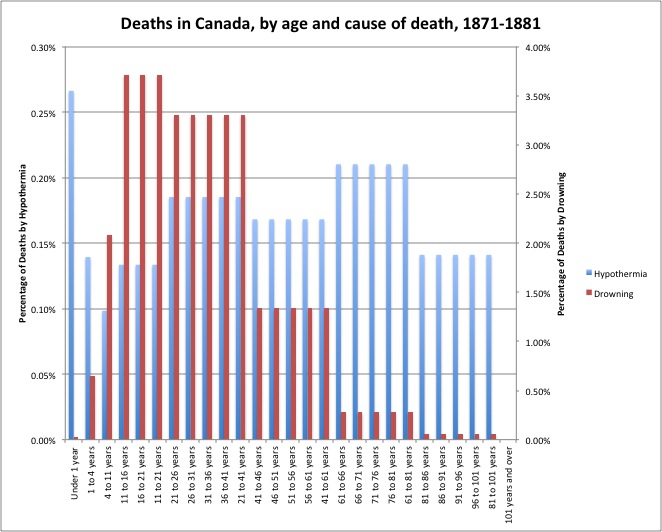
In general terms, however, the census data shows that seniors were at high risk of hypothermia in the late nineteenth century. Those who froze to death in the 61-81 age range made up a higher proportion of deaths than any other age group. People in their 60s and 70s were about as likely to die from freezing to death as drowning, and people above 80 were over twice as likely to die from the cold.
Percentage of Deaths by Hypothermia and Drowning 1871-1881. Source: Censuses of Canada, 1871 and 1881, Vol II Population.
While hardly the last word on hypothermia, these data aggregate two trends from census data in two years (1871-1881) where cold and frostbite were recorded as causes of death. It shows that freezing to death was most common among the senior and middle-aged population, but people of all age groups were at risk. The threat of hypothermia was much more evenly distributed across the stages of life than it is today.
To follow the comparison between freezing and drowning in the twenty-first century, the threat of drowning was much more prevalent in the nineteenth century (659 people drowned each year in the 19th century, compared to 93 people per year in the 21st) likely because of safety and navigational changes in the fisheries. Those who drowned were typically working age males, between the ages of 11 and 41. Still, when plotted on a secondary axis the age trends between these two causes of death in the late nineteenth century and the early twenty first century are demonstrably similar.
Writing about this racially and socially unequal affliction from the “front lines” in Saskatoon, as it were, one hardly knows where to begin. Perhaps the simplest way is to acknowledge that we live and work on First Nations land. We have deep rooted systemic problems. We have a history of injustices which come to light with exhausting frequency.
By 2014 we couldn’t ignore what happened to Neil Stonechild. And we can’t ignore the Canadians who are most at risk of hypothermia today. I hope as winter approaches we warm up to the idea of becoming communities who refuse to leave anyone out in the cold.
[1] L. McCullough, S. Arora, “Diagnosis and treatment of hypothermia,” American Family Physician 70 (2004): 2325-32; John Valiant’s account of the one of the toughest timber cruisers in BC demonstrated the protagonist’s hardiness by his ability to pass out drunk in a snowbank and wake up the next day breathing. John Vaillant, The Golden Spruce: A True Story of Myth, Madness and Greed (Random House LLC, 2009).
I’m happy to report that I have started a new position as Postdoctoral Fellow in History at the University of Saskatchewan. From 2012-2014 I was the NiCHE Project Coordinator, and before that a SSHRC Postdoctoral Fellow, at the University of Western Ontario. It was a great and productive experience with new websites, posters, collections, workshops, and book chapters (in HGIS methods and PEI agriculture) to show for it. Now that the NiCHE Cluster grant has concluded, its website, including The Otter ~ la loutre blog, will continue under an editorial collective.
My new fellowship is with the Sustainable Farm Systems (SFS) SSHRC Partnership Grant led by Dr. Geoffry Cunfer at the University of Saskatchewan, in Saskatoon. Here I will build on the work of the Great Plains Population and Environment Project, conducting new research in agriculture on the Great Plains/Prairies and in my own case study of Prince Edward Island. My larger research program has always focused on the limits of agro-ecosystems, from flax production on the edge of the semi-arid grasslands land to abandoned farms “going spruce” in Prince Edward Island. In this vein I will be applying the new methods of socio-ecological metabolism and particularly the Energy Return on Investment (EROI) models developed by the SFS team across five research groups in Europe, Latin America, and North America.
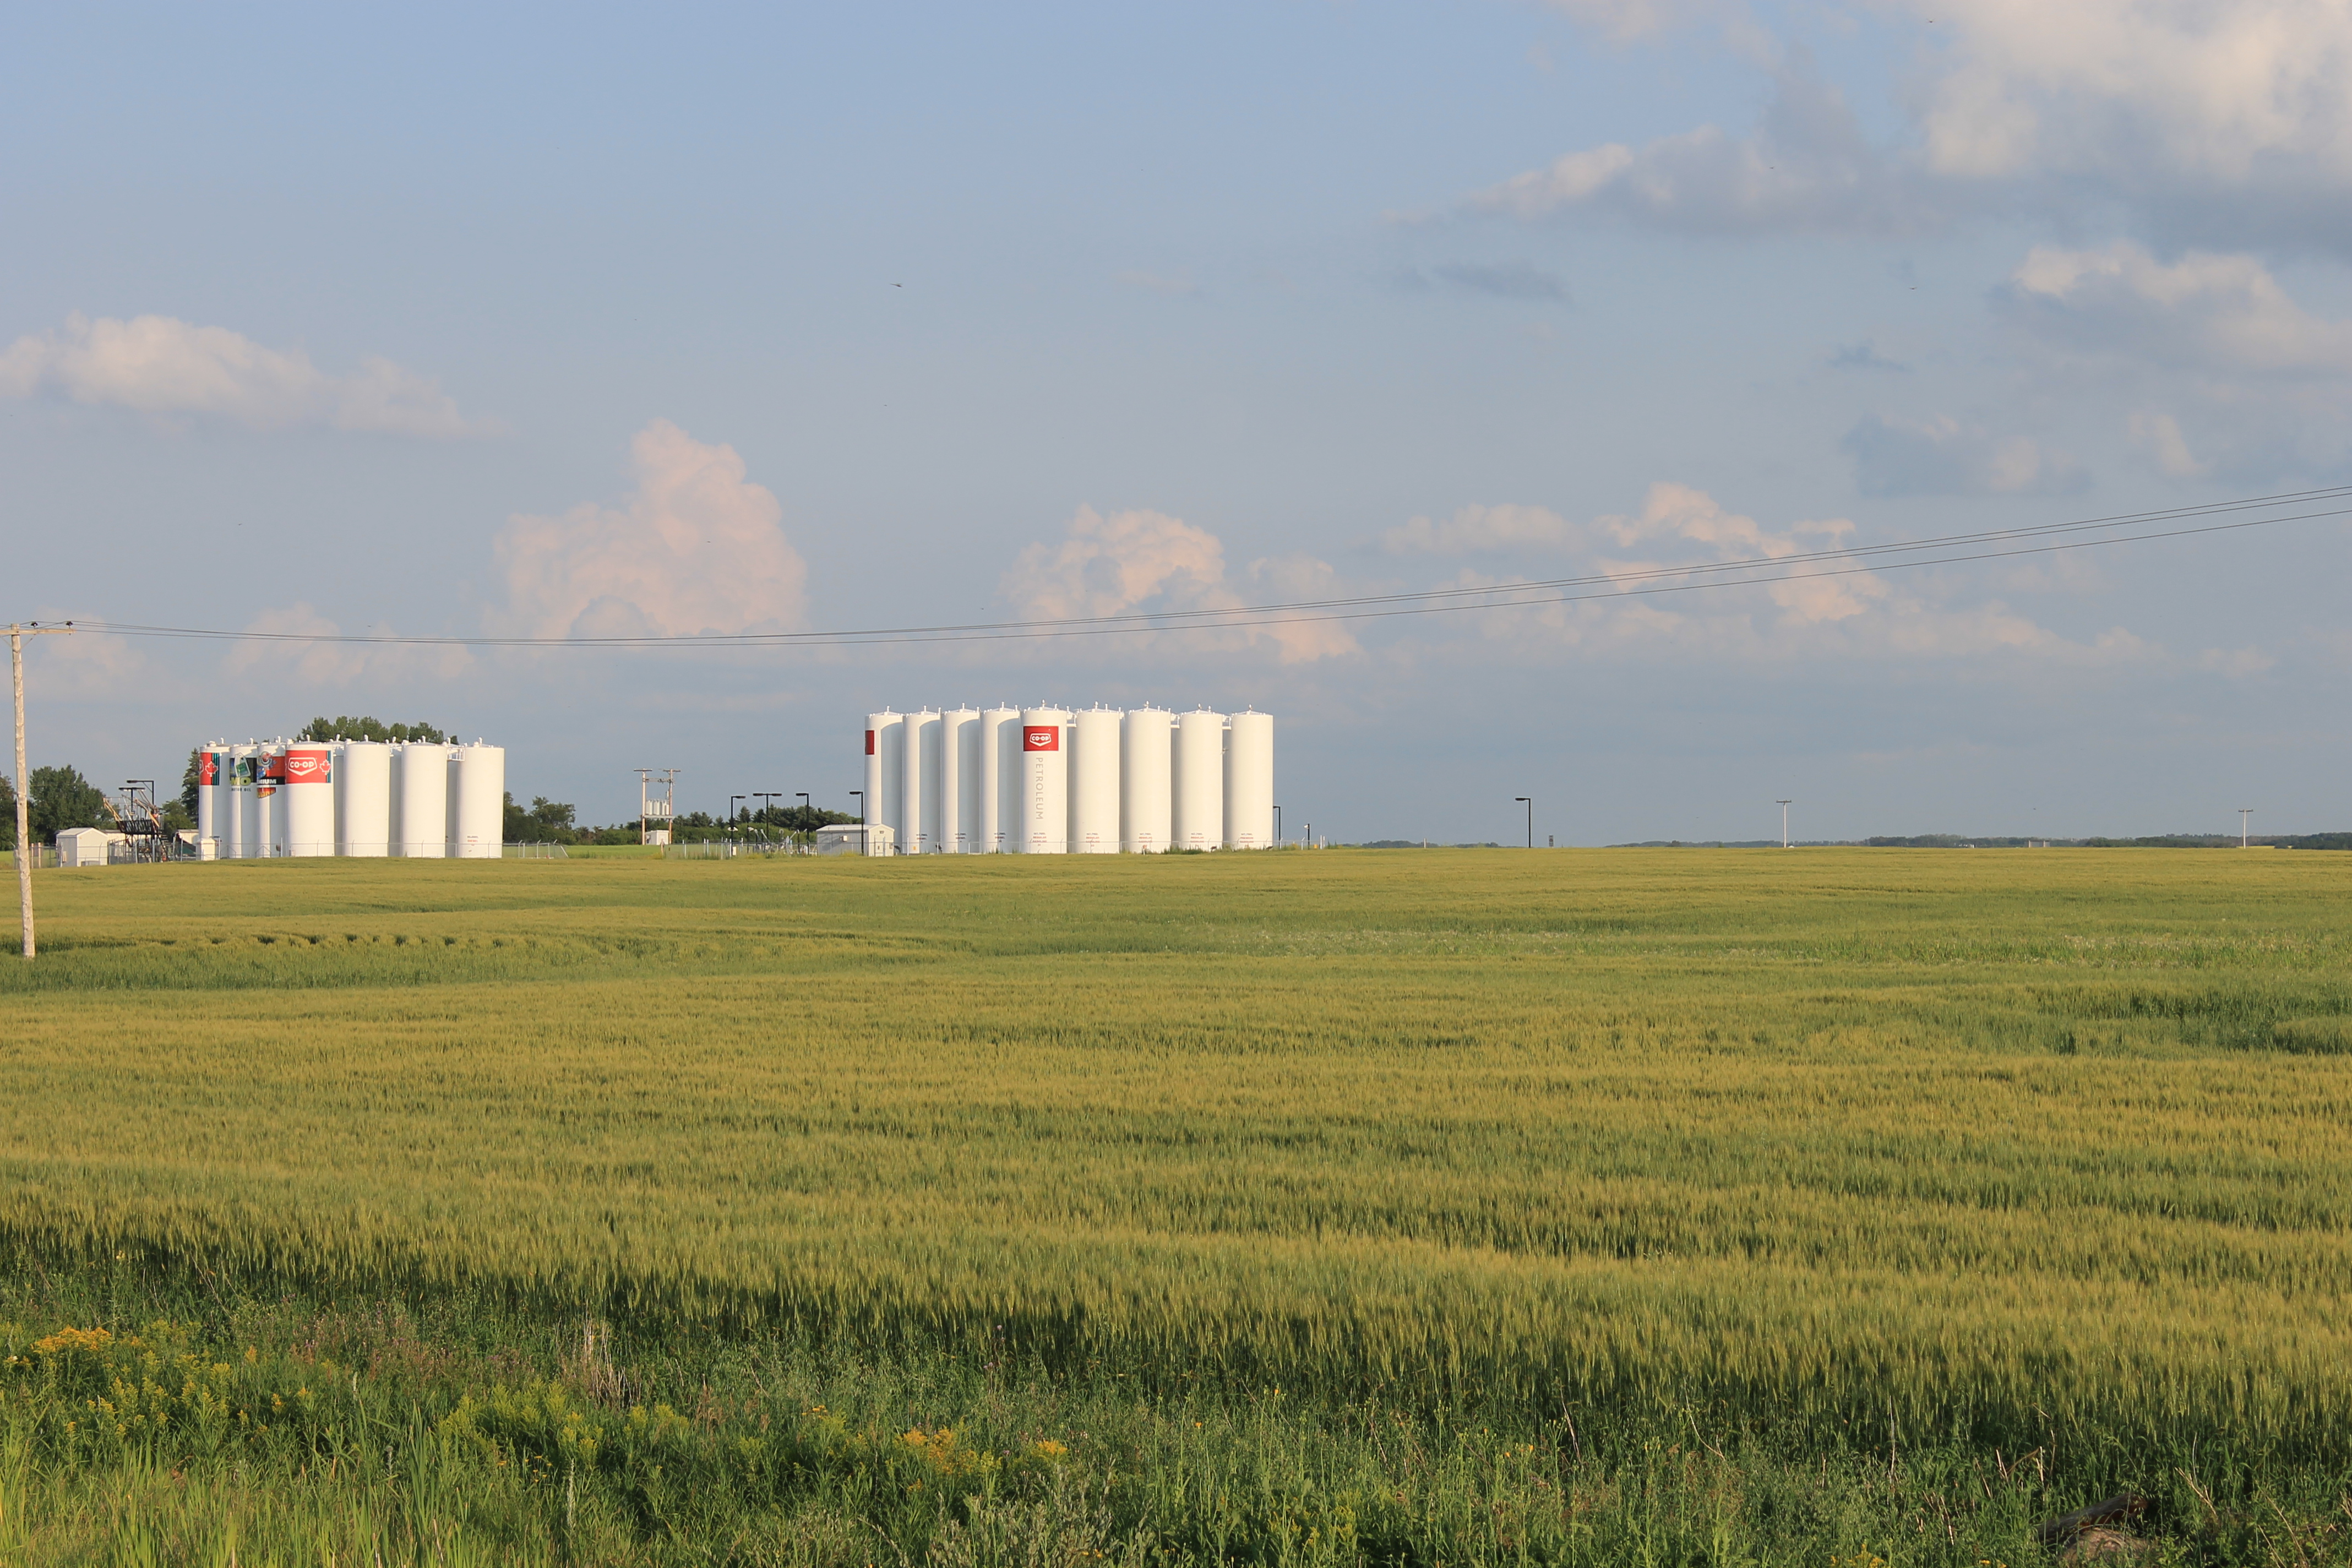
I am an Environmental and Digital historian interested in how global commodities influenced modern agriculture and land use in Canada and the U.S. I’m particularly interested in Canada’s “other oil,” triglycerides, and how the development of new consumer goods created a global oilseed industry, first in flax and cottonseed, but later in soybeans, sunflower, corn, and Canola. The role of the European wheat market is well known in Prairie historiography, but the rapidly growing chemical sector also helped shape the Plains during the Second Industrial Revolution. My research focuses on these transnational specialty crops that appeared first in the lower Great Lakes farm region and then reemerged in the northern Great Plains and Prairies.
Two different types of energy stores on the Plains. Photo: J. MacFadyen, August 2014
By examining the EROI of Plains agriculture, I will be building on another aspect of my recent research. My SSHRC Postdoctoral Fellowship focused on biomass energy and the land use patterns created by harvesting the most important perennial crop in Canada – firewood.
Flax and firewood may seem like obscure topics, but I argue that small shifts in the consumption of ordinary commodities had major ripple effects across North American landscapes. And I’ve found many like minds in Environmental History. The interest in biomass energy has caught on, if I may, as shown by the many papers on the subject at recent conferences in the field. I’ve also entered what one might even consider a concentration of historians interested in fats and oils. Here in Saskatoon – a centre for oilseed research – historians like Geoff Cunfer have written extensively about corn and cotton, Jim Clifford works on tallow in the British Empire and Patrick Chasse studies palm oil and other agricultural commodities in Guatemala. In Spain, Juan Infante and others from the Andalusian branch of the SFS team, are experts on the history of olive oil in Mediterranean agriculture.
These are just a few of the reasons I’m looking forward to this new position. There’s a lot of excellent environmental history happening here at the U of S, and I hope to continue helping to build the Canadian network here and as a volunteer editor with NiCHE.
Many Canadians had a brush with homelessness, or at least heat-lessness, over the holidays. Over half a million customers across Ontario, Quebec, and New Brunswick spent Christmas in the cold and dark, and ten days after the 2013 ice storm homes were still coming online. With the region currently experiencing snow storms and extreme cold temperature warnings, Canadians may be thinking about the fragility of urban energy systems and our level of preparedness for extreme weather events. (At least we seem to be intrigued by travel delays, frost quakes, ice mayors, historic frozen negatives, boiling squirt gun experiments, and of course Frozen, as well as more serious local relief efforts such as Coldest night of the year and “In from the Cold” campaigns.)
The ice storm was deemed the largest in Toronto history, but since it follows only fifteen years after a similar ice storm in Quebec and Eastern Ontario these may not be isolated 100-year events. Extreme weather events appear to be on the increase, and 2013 was a banner year. Debates over the Toronto’s preparedness and resilience are ongoing. Anthony Haines, CEO of Toronto Hydro, promised there will be discussions regarding future improvements and “there is no doubt, learning is to be had.” Winter storms can be especially risky when cold weather and power outages overlap, and historically, extreme cold has been far more lethal than floods and heat waves.
I suggest that the kind of learning “to be had” includes a broad understanding of our historical relationships with extreme weather and urban energy supplies, including food and heat. Climatologists will be working to identify the frequency of these weather events, but historical climate data also allow historians to create detailed risk-maps of extreme cold weather events in Canada over time. Historical research in energy, transportation, and urban planning may then show us how Canadians adapted to these challenges over time.
Nineteenth-century Canadians were well aware of the risks of extreme cold weather, which ranged from the ancient belief that you could “catch your death of cold” to the fate that befell most of Napoleon’s Grande Armée. Remarking on the latter’s winter march from Moscow, Armand de Caulaincourt said “Bad luck to those who fell asleep by a campfire. … Sleep comes inevitably, and to sleep is to die.”[1]
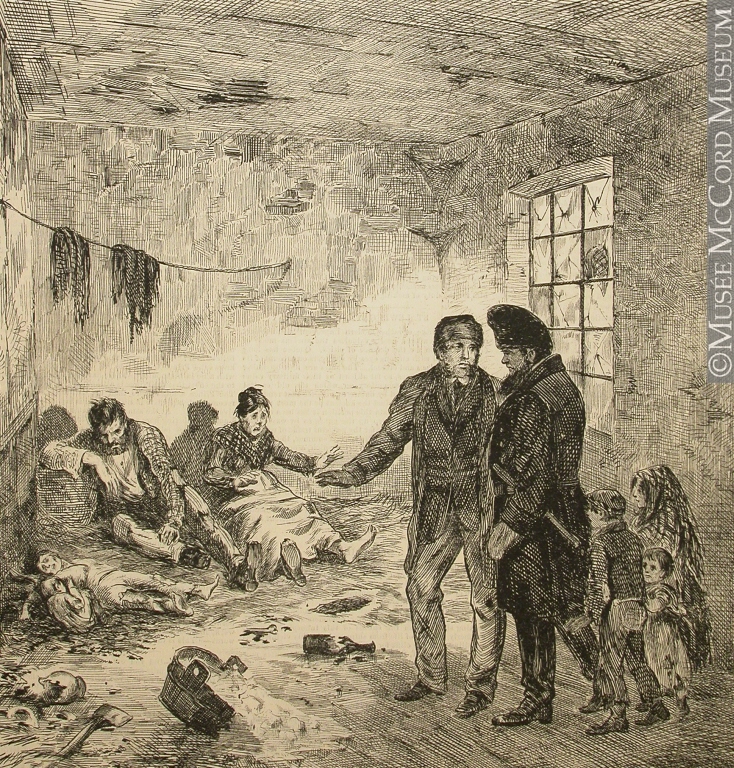
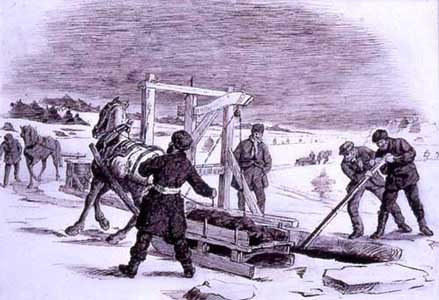
“Frozen to Death,” Montreal 1872. Source: McCord Museum
That final slumber came to many poor and homeless in Canada when fuel prices were high and temperatures very low. In January 1872, several people, including children, were found frozen to death in poor districts of Montreal, and social reformers jumped on the opportunity to illustrate the effects of urban poverty and alcoholism. The Canadian Illustrated News featured a graphic sketch of one scene discovered by the police; the officers likened the frozen babies to “lumps of marble” and a poet left the following summary:
Only two babies, mere waifs of humanity,
Huddled together, half covered with rags;
A father and mother, half plunged in insanity
By the drink from the bottle they had drained to the dregs.
What of it? Their dwelling was merely a ‘den;’
Broken windows; no firewood; not even a bed.
Can we wonder, if, with the cold atmosphere when
The frost should have numbered these babes with the dead?[2]
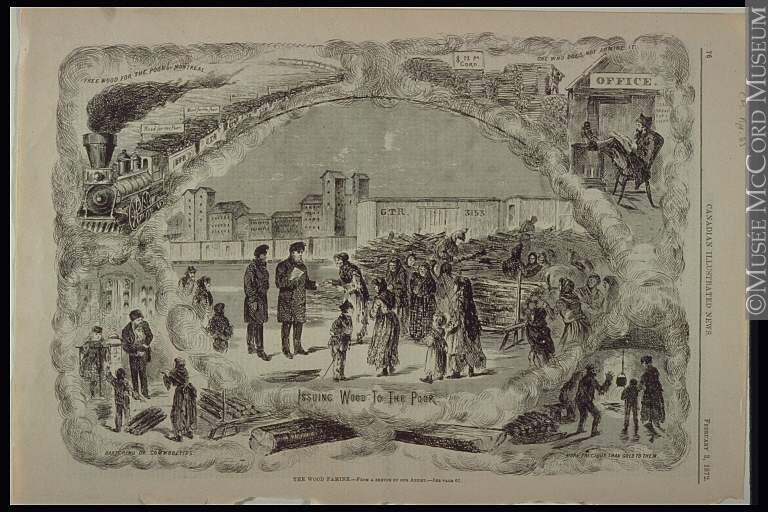
Railway companies jumped on other opportunities. The Grand Trunk Railway responded to the Montreal “Wood Famine” by calling foul on the city’s fuel suppliers. For decades these regulated merchants imported fuel on the St. Lawrence River, and naturally raised prices as the supplies dwindled.[3] An early freeze in the winter of 1872, meant that the price of fuel in January was about $12 per cord, or about twice what it cost in July.
The Illustrated News felt this was unfair-market value, and another image shows the city’s poor freezing to death while icy-fuel suppliers charged exorbitant amounts for firewood. As with many problems of this era, railways came to the rescue, circumventing the seasonality of river-based fuel supply, and it helped to have a disaster like the “Wood Famine” to promote new lines to wood markets.
The railway magnate Asa B. Foster gave away 100 cords of firewood, and the GTR subsidized carloads of cordwood at an eighth of its market value. These trains arrived in the ice-locked city with banners flying overhead titled “wood for the poor.” Impoverished families then warmed themselves and cooked their food over the fuel, and the paper called this firewood “more precious than gold to them.”
Like those in the 2013 ice storm, 19th century Canadians found that the right fuel at the right time is priceless. “The Wood Famine,” Montreal 1872. Source: McCord Museum
I am exploring these urban energy chains in my research, and in a recent chapter on wood energy in Canada, I have found a significant discrepancy in the data historians have used to explain energy consumption in Canada. I offer new estimates for biomass energy consumption, and I argue that Canadians remained predominantly hewers of wood (or at least burners of wood) long after the supposed “transition to fossil fuels.” One excerpt and image from that chapter seems pertinent in the aftermath of the ice storm. It shows that even in Ontario’s small mill-towns (which historians claim were among the first to abandon wood energy), a variety of fuel supplies existed cheek-by-jowl.
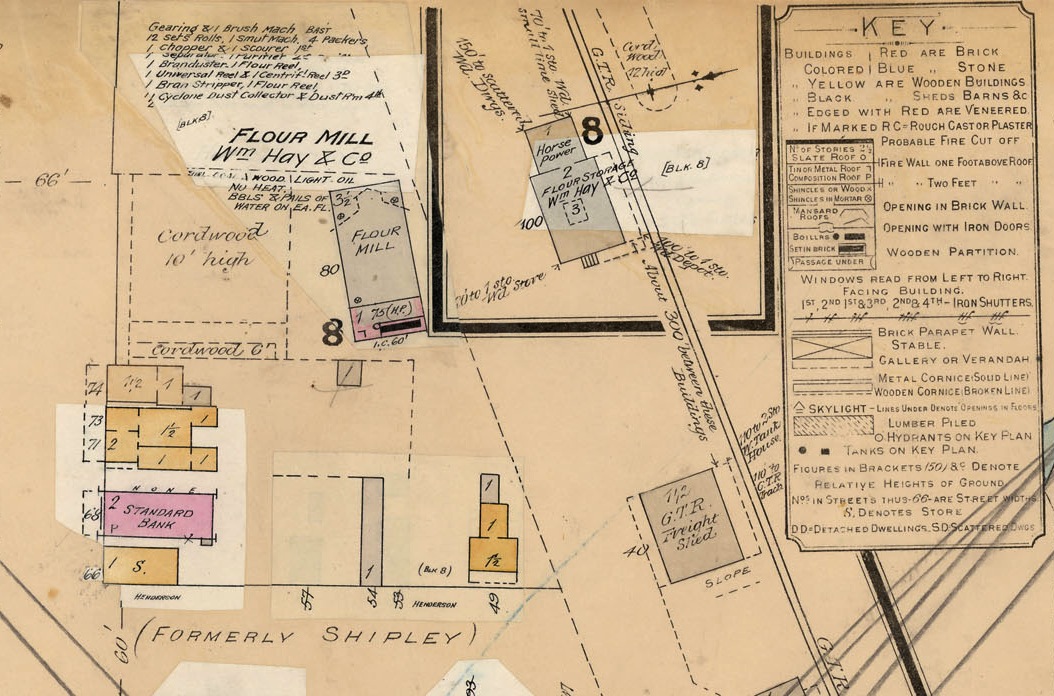
Part of the urban and small-town fuel footprint is visible in late nineteenth century Fire Insurance Plans. Piles of cordwood ranging in height from 6 to 12 feet were common sights in many mill yards. Certain industries were attracted to cordwood over coal, especially if cleanliness was important to the mill product. The William Hay & Company flour mill in Ailsa Craig, Middlesex County, contained three woodpiles, and the largest held over 400 cords, possibly for multiple businesses. The Crediton Flour Mill, owned by H. Switzer, was also flanked by three piles of cordwood, ranging from 4’ to 8’ high. Blacksmiths and foundries needed a wider variety of fuels, and H. C. Baird’s Eagle Foundry in Parkhill had a large cordwood pile, a small 1-storey coal shed, and a 1-storey “Coke & Sand” building. Large wood and metal fabrication companies like the Ontario Car Company in London powered their kilns, smithies, and machine shops with “wood & shavings” stored in a massive cordwood pile located beside the company’s rail siding in the 1880s. Even in urban and small-town industry, the Canadian energy landscape was very much mixed.
(for a draft copy of the entire chapter contact joshmacfadyen@gmail.com)
Cordwood in Ailsa Craig, Fire Insurance Plan (detail) 1903
Canadian homes and businesses burned large quantities of firewood that went unrecorded, and they relied on the biomass equivalent of modern utility companies. Bringing energy to urban areas has always required elaborate supply chains. Everyone needed a relationship with a supplier, billing and payment systems, transportation grids and storage depots, burning technologies and people to service them. Almost every town had “coal & wood” dealers, and in the 1870s, as Canada began its second wave of railway expansion, some lines were built, and partly subsidized, for the purpose of bringing rural firewood to urban markets.
The fragility of urban energy systems
Torontonians had a small taste of everyday life in the past this Christmas. Today we are used to controlling our energy with a switch, and never having to worry about leaving it unattended, but this is a fairly recent development in cold climates. Solid burning stoves and furnaces were the primary heating source for the majority of Canadians until the post-war period. Most of these technologies worked without electricity. Before oil and natural gas heat sources were more widely adopted and supplied by a grid, furnaces required constant supervision, and all homes with running water had to be closely monitored in the winter months.
The power outages remind us of the major problems that occur when our relatively fragile urban energy supply systems are interrupted. In the middle of a heatwave, the loss of power can lead to spoilage, dehydration, and in extreme cases, death. In an ice storm, Canadians endure property damage from fallen trees and frozen pipes, but they also face more extreme risks such as food shortages, car accidents, and exposure sometimes leading to hypothermia and death. Others try to stay warm with barbeques, generators and even coal, and instead put themselves at risk of house fires and carbon monoxide poisoning. Most public institutions and many larger businesses have generators, but demand soon outstrips supply. Restaurants but can only serve so many people when their suppliers are without power or unable to transport goods.
Twice as many people die from these cold conditions than from extreme heat in the United States.[4] The ratio is much higher in the northern states and in climates like Canada’s.
Frozen (to Death)
Most Canadians are familiar with famous cases of hypothermia such as the victims of the Franklin Expedition, the Scott Expedition, the Titanic (whose passengers technically succumbed to “cold shock” not hypothermia), or perhaps even the Saskatoon freezing deaths, but probably none of us personally knows of anyone who has frozen to death. There are several reasons for this.
First, the Canadian Vital Statistics, Death Database shows that an exceedingly small proportion of Canadians die by “Exposure to Forces of Nature.” This is one reason why it seems so shocking to hear of someone who was lost in a blizzard or frozen to death, often within a stone’s throw of safety. Yet in northern climates it is still a very real concern. Of all the accidental deaths since 2000 the overwhelming majority (78 percent) died from “Exposure to Excessive Natural Cold.” Most freezing deaths are men, but some particularly disturbing recent cases have included abused women and children.
However, roughly the same number of victims perish from the cold each year as those who die by drowning, and yet we are much more aware of deaths by drowning. (Oddly, drownings are not included in the “forces of nature” category.) Most of us are willing to risk a swim in the ocean, but not many try sleeping outside in January.
The second reason you’ve probably never personally heard of someone who has died in this way is because of the demography of cold weather victims. A breakdown of the data shows that the largest group of drowning victims are teens and twenty-somethings, but victims of cold weather are older. Most are over the age of 50. And whereas drownings happen at the resorts and beaches of the middle class, cold weather deaths are probably more likely to occur in alleys, abandoned buildings, and other residences of the poor and homeless.
Accidental deaths by drowning and freezing in Canada, by age (the reason you’ve probably never heard of someone freezing to death.) Source: Canadian Vital Statistics, Death Database
Toronto Mayor Rob Ford noticed similar demographics at the city’s warming stations during the outage. “For some reason or another it seems like it’s seniors are the ones that don’t want to go. They just want to tough it out.”
It’s possible that some older residents were made of tougher mettle, but it’s more likely that they are less mobile and less able to “sleep over” at places like warming centres. For those without family the challenges can be threatening. One 76-year old Cancer patient opted to stay put in his freezing basement over the holidays, because his diagnosis (not to mention a fallen electrical wire in his driveway) made leaving riskier than staying. Still, this Austrian survivor of the Second World War claims it was only “the fourth or fifth worst Christmas of my life.” He had a small stove and his son brought some firewood from Waterloo, but still the basement hovered around 10 degrees.
Where do you go for fuel?
For all of their conveniences, we forget how much we rely on hydroelectricity and carbon supply chains (both biomass and fossil fuels) for staying warm and fed in the twenty-first century. Ice storms are a poignant reminder, and when they cause outages for more than a few hours, people start looking for things to burn.
Most gas and oil furnaces are useless without electricity to power the burners and circulate the heat, and most new gas and even wood pellet fireplaces require electricity for the same. Homeowners with open hearths and solid-fuel burning stoves are in luck (apartment dwellers are not), but only if they have a supply of dry firewood and kindling at hand.
People quickly discover that firewood is not a simple commodity. Burning furniture and fabrics is an expensive way to keep warm. They disappear in minutes and do not give off much heat. Firewood requires processing, and there is a surprising range of quality and price depending on whether it is hardwood or softwood, dry or “green,” blocked or split. People offering “free” firewood in the middle of an ice storm may seem like heroes, but if it consists of large, green, ice-covered trees and tree limbs like the wood in this picture it is more yard waste than fuel.
“Free firewood from trees damaged by the ice storm was offered in Oakville, Ont., on Christmas Day 2013.” Photo: RICHARD BUCHAN / THE CANADIAN PRESS
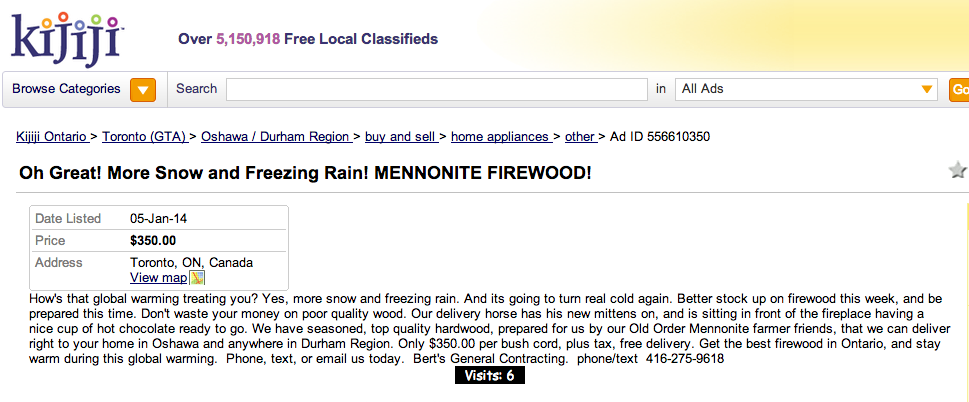
Others, like the Toronto-area businesses who advertised “Mennonite Firewood” in response to the ice storm (and every weather report since), show that the commodities – and the marketing techniques – of the nineteenth century energy chains live on 141 years later.
Kijiji ad for “Mennonite Firewood” January 5, 2013
[1] Armand-Augustin-Louis Caulaincourt, With Napoleon in Russia translated by Jean Hanoteau (New York, Morrow 1935).
[2] Alpha, “Frozen to Death,” Canadian Illustrated News, January 27, 1872, p. 50.
[3] Robert Sweeny and Goupe de recherche sur l’histoire des milieux d’affaires de Montreal. Les Relations Ville/Campagne: Le Cas du Bois de Chauffage (Montreal: Montreal Business History Group, 1988), cv.
[4] Christopher R. Adams, “Impacts of Temperature Extremes,” Cooperative Institute for Research in the Atmosphere < http://sciencepolicy.colorado.edu/socasp/weather1/adams.html>, accessed 1 January, 2014; Edwin M. Kilbourne, “Heat Waves and Hot Environments” in Noji, Eric K., editor, The Public Health Consequences of Disasters, New York, Oxford University Press, 1997: 245-269, 270-286.
Historians are faced with an unprecedented data recall problem. New sources are being digitized and discussed on the web at such a rate that the notes for your current history project are out of date shortly after you write them. The most successful academics are not the ones who know the most information, but the ones who know where to find it and how to analyse it. They are the connectors; making connections between the right people and the best stories at the right time.
This post demonstrates another way you can catalogue the historical information you already know (your library) and access it when you need it the most (1 hour before your writing deadline). Often we find ourselves looking for a reference when the library is closed and all you have are the books on your shelf. It’s a needle-and-haystack situation. Or, maybe a more generous way to frame the problem is that the books we have on hand are the most important contributions to our work, and it could be extremely useful to have a searchable index of the books in a certain collection.
Google Books lets us search and preview the full text of an enormous collection of books, but often this kind of search is too broad. Historians spend their careers screening useful books out from the rest and collecting books according to their research interests. It’s often more useful to search the books in your own collection than it is to search every book that has ever been digitized. Google Books offers this search function too, but it takes a certain amount of prep work. This is the first of a few posts on digital tools for environmental history that will appear on The Otter throughout the fall.
The Library at NiCHE
After cataloguing and organizing over 500 books using the U.S. Library of Congress system, we set out to create a digital catalogue of the NiCHE library that allowed for wireless and off-campus searching using Google Books. Part of our jobs at Western included (Mike) cataloging and (Josh) sitting next to NiCHE’s massive library of over 500 books on history and environment. (Josh has been unable to get any meaningful work done because he keeps getting distracted by one of your books!) Having the books catalogued and organized was a good way to find one when you needed it, but visitors and other people at Western mostly have no clue what books are in the collection. Rather than taking a shot in the dark, looking up a book’s call number, and then getting access to the library in hopes that it’s there, we thought the collection should be catalogued in an online library like Google Books (other examples include LibraryThing, Readerware, Collectorz, GuruLib, and Goodreads).
The reading room
It’s relatively easy to sign up for an account with one of these digital library apps, and entering your titles one at a time is a snap. Of course, entering them one hundred at a time sounds even better, no? This is easier than it sounds. Most books printed in the last forty years were issued a bar code containing their ISBN, a number that ensures you are cataloging the exact title, author, edition (and even binding type) of the book in your hand. The bar code can be scanned with a USB scanner, webcam, tablet, or smartphone. We used an iPad from Western’s Digital History Lab. Over eighty percent of the catalogue was scannable leaving less than a hundred books to be manually entered to our Google Books library.
One of the tools we used for this cataloging process was Zbar scanner, an app for smartphones and tablets that reads barcodes and converts them to ISBN numbers that can be uploaded to Google Books.
If you have never really used a bar code reader or app (such was the case with Mike), then the first experience of creating your digital catalogue can be a bit frustrating. You will need to set time aside for downloading the app and doing a few test runs to make sure things are working properly. It will also take a few books to get the knack of how to hold your device and place your book for fast and easy scanning. Do not fear. The rate and ease at which you are able to scan your books will grow exponentially. Depending on the size and age of your library, it could take you significantly less time to digitize your entire library than it does to read one book. Once your library is created, adding new books is a snap and can be done from anywhere in the world using just about any device with an internet connection.
Basic steps:
1. Create a Google account, if you don’t have one, or since ours is a shared library we decided to create a new account called “nichelibrary”
Paul Sutter was here
2. You can either enter the titles of the book manually by searching for it as you would in a library catalogue
3. Or you can use Zbar scanner on your phone or tablet to catalogue your books more quickly
Zbar scanner app for mobile devices.
4. Tap the camera icon to activate the scanner and hold the phone over the bar code on the book.
Aim for the bar code
5. The app will recognize the bar code and the ISBN will automatically appear for the book
Scanning result
6. You can then check on Google or Amazon to see if the bar code scanned properly and found the correct book
Check the ISBN
7. Then you can click back 2 levels to get back to your collection (NiCHE Library)
All scanned ISBNs
8. Watch out for obscured or damaged bar codes
Obscured bar code
9. Go back to the list of numbers under the collection name tap the new message icon to send an email with the latest books you scanned and a csv file that can be opened in Excel.
10. Open Google Books and sign in to your Google Account.
11. Go to “My Library” and add a “new shelf”
12. Click on the newly added shelf and then click the gear on the right side and select “Add by ISBN or ISSN”
13. Copy and paste the ISBNs from the csv file and click “Add Books”
14. Now you can sort your books, add comments, and… search them. Underneath your profile on the left side you should see a box that says “Search My Library.”
Results
Now you have essentially created a catalogue of all the books on your shelf, and a searchable index to every one of your books in Google’s collection. It is now possible to log into your account, go to My Library under Google Books, and select “Search my library” to find references in the books we have at hand.
For instance, if we try a search for “otter” in the NiCHE library we see that the word appears in 6 out of the 495 books in the collection. (After you all publish your next books we expect references to The Otter will rise substantially.) If you can’t remember where that reference to otters went in Laurel McDowell’s textbook, or if you couldn’t remember if it was in her book or Neil Forkey’s, you can use Google Books to find the reference (and then go to the shelf and read it in hard copy, like a human).
It is also possible to search other people’s collections (provided they haven’t made their collections private). Give it a try. Go to this link to search the NiCHE library. Hopefully your book(s) are there; if not, send us one! Search the shelves for content related to your topic. Again, thumbing through a large specialized collection like this is often more useful than searching the entire English cannon if you’re looking for research that resonates with a community like Canadian environmental historians.
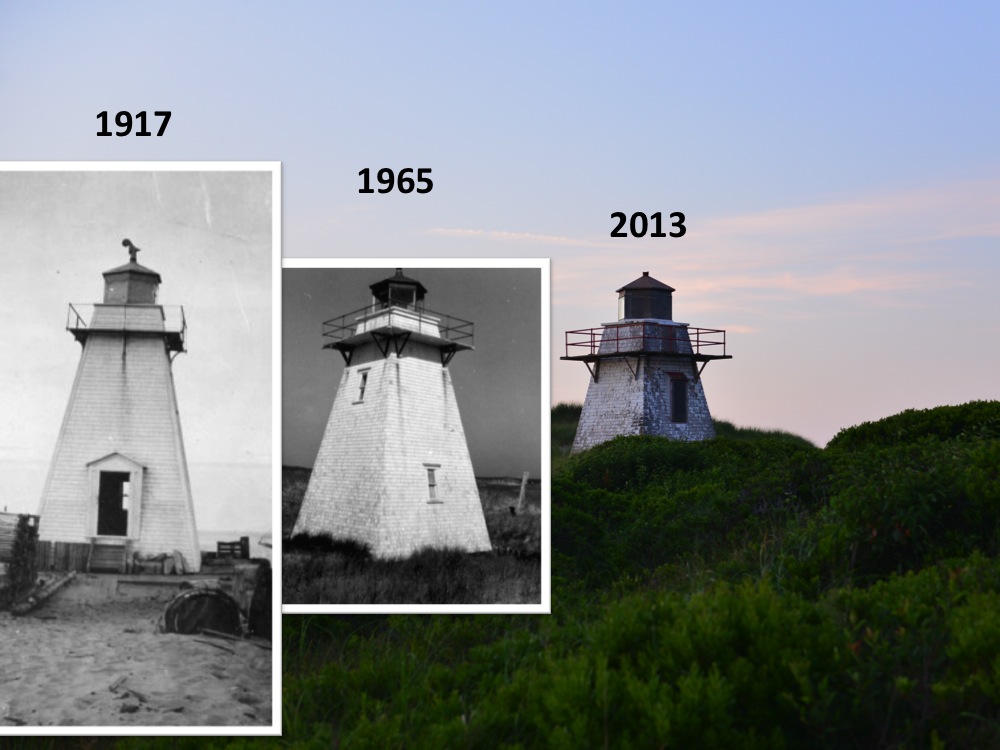
Once a jumping off point for swimmers, this lighthouse is now 600m from the channel at St Peters Harbour PEI due to coastal accretion. Historical photos courtesy of Carol Livingstone, PEI Lighthouse Society.
At the start of the summer NiCHE asked for our favourite and most meaningful photos from summer research or vacation. OK I’ll bite. I’ve seen some amazing landscapes and images so far this year, being lucky (or maybe foolish) enough to have travelled from Vancouver Island, BC to Twillingate Island, Newfoundland, and spent at least a few hours in seven other provinces. But the most meaningful photos to my research have been of the lighthouse at St. Peters Harbour, Prince Edward Island, the earliest in 1917, another in 1965 (both courtesy of Carol Livingstone), and the latest taken by me in July 2013.
I’ve never actually come across a lighthouse in my research, but something keeps bringing me back to the north shore of PEI, and to St. Peters Bay where this structure is testament to a changing coastline. My research is mostly about how Atlantic Canadian farmers procured fertilizers and fuels from wildlands, but I’ve also been interested in the use of aerial photographs for studying both land use and landscape change. Alan MacEachern and I discussed St Peters and other North Shore landscapes in Time Flies, a poster at the American Society for Environmental History in Toronto this year, and I recently wrote about mussel-mud digging farmers a little further up St. Peters Bay in Land and Sea. The aerial photographs show that the landscape has changed dramatically since 1935, but it wasn’t until I visited this particular lighthouse — ironically difficult to spot on a vertical air photo — that I realized how extensively this coastline was shaped by the sea.
Walking along the shore west of St. Peters Bay, it does not seem obvious that the early twentieth century beach was once over 150 metres landward. But the location of a square tapered lighthouse nestled deep in the sand dunes, and the ruins of a wharf in a shallow barachois pond beyond that provide some clues. Photographs and aerial photos from the last ninety-six years show that the lighthouse was once flanked by flat beaches and the St. Peters harbour fishing wharf (see 1917). Sand was constantly collecting on these shores, banking around the lighthouse by 1965 and filling in the channel to the Bay. The wharf site was abandoned in 1951, but the lighthouse remained an ever-fixed mark, a datum in the rising sand. When I was exploring the site a woman told me that her grandfather once fished from the wharf and her uncles used to jump from the top railing into the nearby channel. Now the wharf is mostly buried and the lighthouse is 600 metres from the channel leading into St. Peters Bay.
The accretion of sand around the mouth of the harbour has long been a problem for local residents. For most of the history of this landscape there was of course no lighthouse or wharf at all. When the Mi’Kmaw first appeared on this location the ocean was much lower and further away, and Prince Edward Island itself wasn’t even an island.[1] By 1719, Havre Saint-Pierre was resettled by Acadians, becoming the original and most important Acadian fishing village on what they called Isle Saint Jean. In 1752 French travel writer Thomas Pichon complained about the limited access for large ships and reported a “sand bar that forms at the mouth of the harbour.” The main approach to unwanted accretion is to build large berms in places that would collect the sand before it entered the harbour. These improvements were demanded by PEI officials in 1857 and carried out by Ottawa in the late nineteenth century. But still, engineers could not keep the sand from covering the wharf, entering the channel, and drifting over the lighthouse walls. Thus, St. Peters lighthouse is slowly going the way of Anakin Skywalker’s movie-set home (to which many say good riddance); Anne of Green Gables’ house in Cavendish, PEI, seems safe enough for now.
Lighthouses were critical infrastructure in the nineteenth century. To many travellers they were more familiar and important than traffic lights are to us today, but now that we mostly travel by land, and navigate by GPS, lighthouses are at risk of disappearing. The risk is not just financial but also environmental. Most PEI lighthouses only make the news when their sandy perch is threatened by coastal erosion. As Federal funding disappears and climate change exacerbates coastal change, the outlook for lighthouses is darker than a night of heavy fog. But some lighthouses actually find themselves further from the ocean every year, and in St. Peters Harbour the lighthouse is a beacon for another kind of landscape change.
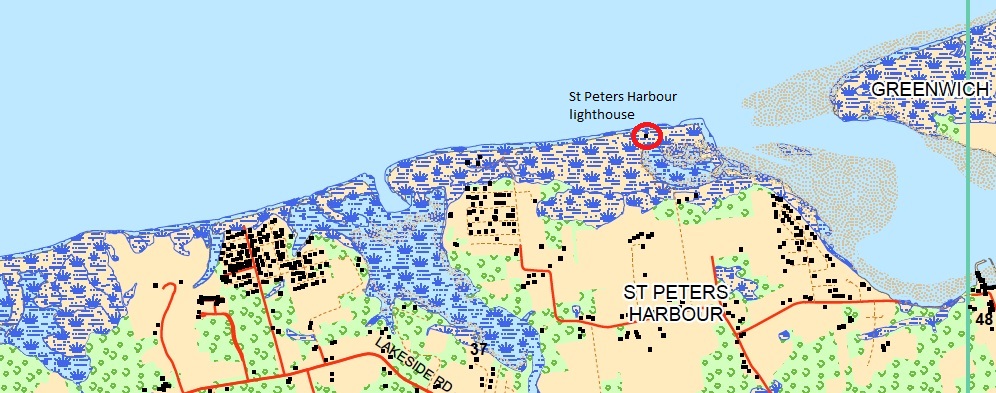
The more we learn about climate change, fragile coastlines, and our own unpreparedness for flooding (for example in Calgary and Toronto), the more we know we shouldn’t be building our houses on the sand. Coastal erosion has caused a major disturbance to estuarine habitats and human infrastructure in Atlantic Canada since the early twentieth century. Many parts of PEI’s north shore are eroding at rates of over 1 metre per year, and sea level rise and the increased frequency and intensity of storms in the twenty-first century suggest it will get worse. The human response to this information has not been promising. The proliferation of residential, recreational and other infrastructure in the St. Peters Harbour area suggests that people will build as close to sensitive coastal areas as possible.
St Peters Harbour Map – Showing development and lighthouse, 2010.
People will also build over heritage areas, perhaps even unwittingly, without a better understanding of human ecology and these historical landscapes. Tracing these shifting landscapes is no simple task. The Greenwich section of the Prince Edward Island National Park is located across the mouth of the St. Peters Harbour, and although it presents an excellent historical and archaeological survey of the inhabitants of St. Peters Bay, it does not identify the location of important nearby sites like the 18th century village of Havre Saint-Pierre, the 19th century harbour improvements, or the twentieth century Provincial mussel mud dredge. Environmental history, including methods such as the interpretation of aerial photographs and historical maps, can help identify these sites and their significance to local ecosystems.
Environmental history is required for more than a commemoration of lighthouses and Mi’Kmaw, Acadian, and Canadian homes and fisheries, but also for an understanding of human ecosystems over time. As Matthew Hatvany has argued, coastal change is highly complex and requires an awareness of both long run history and the ways we think about science.
Postscript: I discovered that the title I was planning to use for this piece, “sea change,” was scooped by Lapham’s Quarterly on the same day (The LQ podcast Out at Sea features some exquisite readings by Lewis Lapham). “Washed up” or “Beached” lighthouse didn’t have the same ring to them, so I went with Swallowed by the Seashore.
[1] Kate MacQuarrie, “A River Ran Through it,” Island Magazine 49 (Spring-Summer 2001): 16-25.
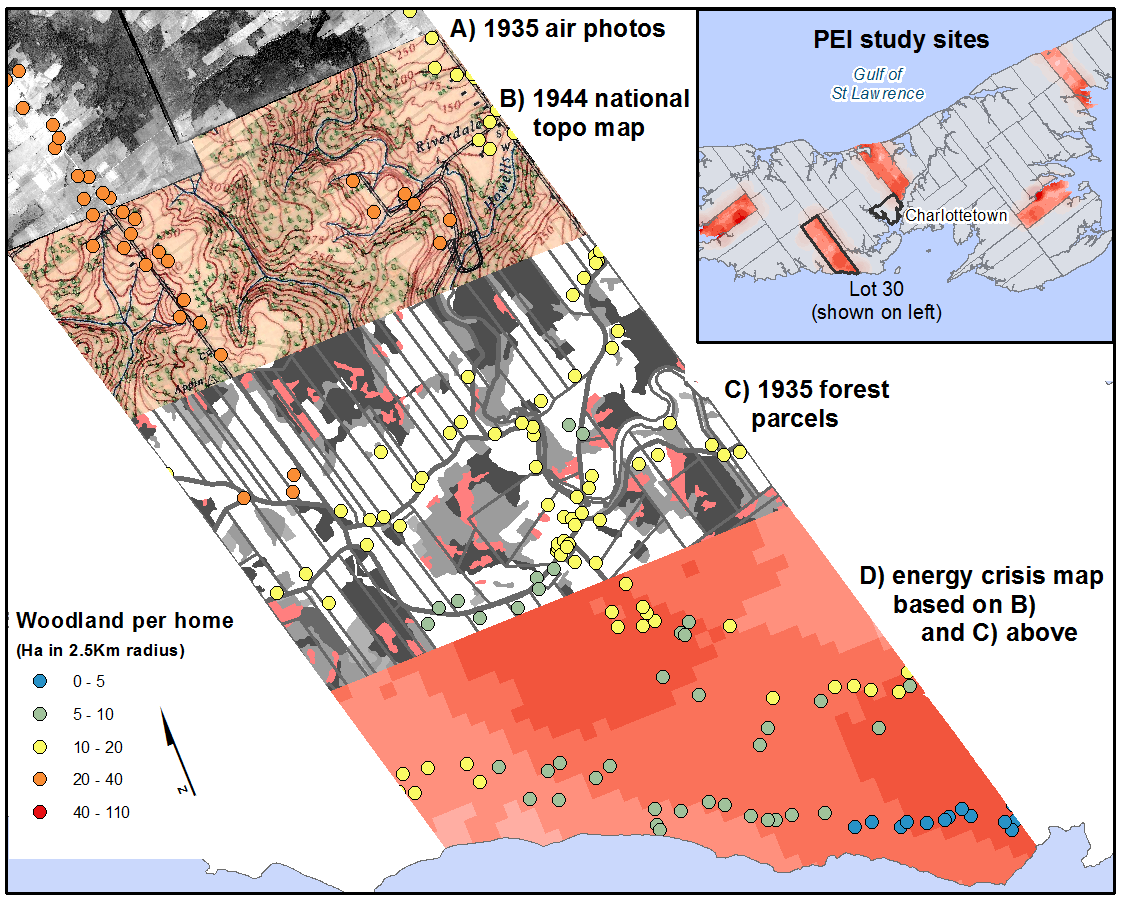
Recent studies of aerial photographs suggest that Prince Edward Island’s first energy crisis was not the 1973 oil embargo but a firewood shortage that predated OPEC by a century. Two posts on The Otter discuss some of the ways air photos can be used to understand landscape change in the PEI National Park, and a new exhibit stresses the importance of seeing these images as snapshots of time as well as place. Air photos can also be used in a Geographic Information System (GIS) to study land cover and land use change, and the resulting data offer a new tool for understanding the difficult balance between clearing forests for agriculture and leaving enough for fencing, forage, and fuel.
Tourists who approach Prince Edward Island on the ferry in 2012 disembark at “Wood Islands” and take in a coastal landscape of relatively unbroken forest, but the ferry’s first passage in the late 1930s would have revealed a very different and almost completely denuded coastline. (Early tourist invitations to “come play on our island” might have included a suggestion to “bring your own firewood.”) The 20th century forest regeneration at Wood Islands echoes a well known story of outmigration and agricultural downsizing in the Atlantic region, evident in sources like the Census of Agriculture. Historians assume that farm abandonment occurred primarily on marginal lands, as families adapted to poor soils and a poorer economy, but air photos offer a detailed portrait and a spatially explicit model of different stresses such as declining access to woodlots and other wildland resources.
At the beginning of the 20th century Prince Edward Island’s forests had reached a nadir from extensive agricultural and commercial exploitation of the forest. But only a generation or two earlier, there was an abundance of forest. In 1861, the average Island farmer lived on properties which were only about 38 percent “arable,” or cleared to the extent they could be cropped. Taking into consideration the other thirty percent of the colony not in farms, we see that only about a quarter of the Island had actually been deforested. Forest historians argue that by the end of the century over 70 percent of the Province was cleared for agriculture and the forest that remained had been harvested several times for the shipbuilding industry and domestic use.
In a recent Otter post I described how Prince Edward Island farmers responded to a critical food shortage, when the Province’s ruminant population outpaced its marsh and upland hay production. Farmers took to the ice and spent a large part of the winter dredging “mussel mud” to enrich their fields and expand the production of hay and cereals. However, this practice was prevalent in areas where farmers had already cleared most of their land, both because growth required either new land or more productive land and because farms in these areas were running out of firewood. With little forest left, many of these farmers turned their winter activities to hauling mussel mud and began to buy coal or commercial firewood for domestic energy.
Using air photos it is possible to identify places where this likely occurred. Figure 1 shows a composite image of four map overlays (labelled A-D on the right) and the location of every home in Lot 30 (labelled on the left), a rural township to the west of Charlottetown. These layers allow me to identify the precise location of homes, the location of the forest, and the places where the density of homes and scarcity of forest would have caused a biomass energy crisis. These data are all derived from PEI’s aerial photographs which were first flown for many Canadian jurisdictions in the 1920s and 1930s. The original air photos were subsequently used to create maps for the National Topographic Series, and in 1990 the Province of PEI also used them to create historical forest and land use inventories. In the final layer, I used a GIS to measure the amount of forest located within a 2.5 Km radius of each home and made an “energy crisis map” based on the density of points in selected PEI study sites.
Figure 1: Forest history data derived from air photos, Bonshaw, Lot 30, P.E.I. 1935. Photos and inventory courtesy of PEI Dept of Forestry.
This map shows areas where rural and small town resettlement was putting pressure on natural ecosystems. For example, Lot 30 had approximately 14 hectares of forest for every home, but the homes marked with blue dots had direct access to less than 5. Clearly these farmers lived in an interconnected world and had access to fuel from local outfits and importers, but what is important here is that their immediate fuel supplies would not have lasted more than a few years at even a conservative rate of consumption.
Additional research and a presentation at the Canadian Historical Association / Canadian Association of Geographers at Congress 2012, in Waterloo, will show what kinds of woodlots remained in the most densely inhabited areas. We might expect that harvesting was most intense in those areas and regenerating plots were not. The forest inventories recorded not only the outline but the cover type of each forest parcel, and GIS lets us query the inventories for these sorts of questions.
The 1935 PEI inventory may be the earliest in Canada, and due to the Province’s small size and complete air photo coverage it is certainly the most comprehensive. Behind the inventories, however, are ordinary air photos, and researchers interested in recreating topographic features can find great coverage of local areas at university libraries such as Brock, Dalhousie, Toronto, Waterloo, and Western. For larger areas consult the National Air Photo Library’s enormous collection and online search engine in Ottawa. All air photos contain distortions, and if your research relies on accurate locations, distances, and measurements it is important to correctly “georectify” and digitize these features with the proper projection in a GIS. Many <href=”#/Fundamentals_for_georeferencing_a_raster_dataset/009t000000mn000000/”>online tutorials are available to help with these processes. If you only require the general description and location of topographic features then you might want to use the closest National Topographic Series (NTS) map for your period of interest.
Aerial photographs, NTS maps, and historical forest and land use inventories offer a new way to study the relationship between farms and forests. If the NTS maps were a sort of census of the Canadian environment in certain years, then aerial photos were the original manuscripts behind the printed census. Just as social and economic historians often need to consult the nominal censuses for a new level of detail, historians of the environment can find information in the original air photos (e.g. forest types, land use, coastal erosion, building location/orientation, sub-urban spaces, pollution and brownfields, etc.) that may not have interested the cartographers.
Further reading:
D. G. Sobey and W. M. Glen, “A Mapping of the Present and Past Forest-types of Prince Edward Island,” Canadian Field-Naturalist 118 (4) (2004): 504-520.
There are several chapters of interest to NiCHE readers in Historical Geographic Information Systems in Canada a forthcoming book edited by Jennifer Bonnell and Marcel Fortin. The chapter by Joanna Dean and Jon Pasher uses air photos and other sources to measure urban forests, and Joshua MacFadyen and William Glen have presented a longer discussion of the PEI forest inventories in “Top-down history: Delimiting forests, farms, and the Agricultural Census on Prince Edward Island using Aerial Photography, c.1900-2000.”
This morning I wrote an article for NiCHE Canada’s blog on the use of mussel mud fertilizer. The extraction and spreading of mussel mud on Prince Edward Island’s frozen fields was a winter activity recorded by all of the 19th century contributors to Real Time Farming. I argued that PEI farmers improved food security and the productivity of mixed farming through the innovative use of mussel mud, a local, organic fertilizer extracted from estuaries. However, mud digging quickly became unsustainable as commercial and Provincial outfits exhausted the mud in several rivers and destroyed some of the world’s best oyster habitats. Farmers clashed with fishermen over rights to shell beds, and Federal officials ultimately encouraged farmers to adopt chemical fertilizers.
In this Real Time Farming post I have collected the mud-digging updates of the farmers, mapped some of their journeys from estuaries to upland fields, and shown how farmers adapted to new work patterns and a new resource. Farmers like the Andersons and the MacEacherns began to rely more heavily on nearby sea manure in this period, whereas farmers like Roderick Munn bought completely new farms in part, it seems, for their access to mussel mud.
York Point
Robert Harris Mussel Mud Digging, Undated, Source: Confederation Centre Art Gallery
In the winter of 1866, Francis Bain mentioned only that he was “at work on the ice,” but he did not explain exactly what he was doing. It is quite possible that he was digging some sort of sea manure for fertilizing his farmland in spring. The West (Eliot) River and North River were the most important mud digging locations in Prince Edward Island, and Bain would have been very familiar with the sight of dozens of sleighs crossing the ice to haul the rich fertilizer to their fields. Bain’s prolific journals rarely indicated who he was with or what they were doing; his focus was on wildlife. But by 1886, we know that Bain brought samples of mussel mud to a farm exhibit, and he described the natural history of mussel mud for readers of the Prince Edward Island Agriculturalist (March 11, 1886):
Every lowly tribe of the deep has brought its tribute of the store-house of manurial wealth. Oysters, mussels, quahogs, clams, the showy valved petracola and the ebony littorina, the delicate cuminia and the great rugged spired urosalpinx, corraline and starfish, sponge and protozoa lived on and were entombed in its mass, while a thousand harvests of algae added their varied foliage to swell its riches.
Rice Point
The journals of John MacEachern are a useful indicator of the shift in PEI agricultural history in the 1860s and 1870s, a shift that occurred as farmers realized the benefit of applying mussel mud to hay fields. High acidity in the soil caused a shortage in food and fodder, and Island farmers began to spread calcareous mussel mud in the period as a solution. In 1866, the winter months were quiet in Rice Point, and the MacEachern family hauled firewood across the ice for consumers in Charlottetown. By 1879, a new activity had made the winter months busier than ever. MacEachern was near the end of his life at this point, and it appears that he did not go with his sons to the mud diggers.
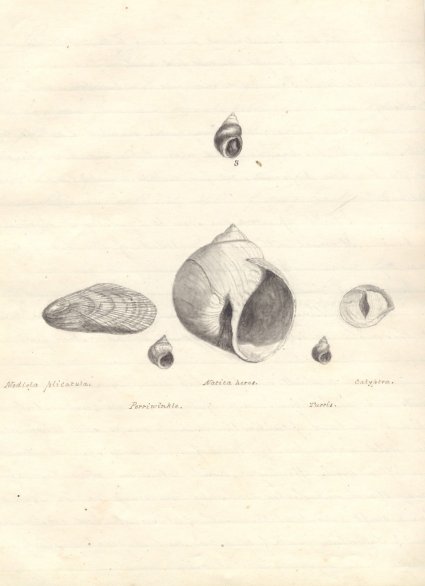
Francis Bain sketch of PEI shells, Nov 3, 1878. Source: PARO, Image No. 4.2353.92
On this day in nineteenth century Prince Edward Island, the farm landscape is only just beginning to emerge from beneath the ice and snow. The shores of York Point, at the confluence of the North and West (Eliot) Rivers at visible for the first time this spring, and the ice sheets break away from the shore and move seaward with great flair — or so it appears in the journals of farmer-naturalist Francis Bain. Bain takes a walk along the shore and is reunited with his “old friends the shell-fish and sea-weeds.” He frequently sketches fauna such as these pliactula, perri-winkle, natica, turris, and calyptra drawn in 1878.
In Rice Point, farmers like John MacEachern observe simply that the “Ice [is] off, and a boat crossed the ferry yesterday.” The movement of the ice began on 2 April with “ice drifting off again,” but rather than watching at the shore, this farmer was cutting poles for his spring fencing, following the ferry passage to Charlottetown, and celebrating the life of a neighbour, “old Mrs Bell, Nine Mile Creek” who “died aged about 90.”
These two accounts from 1866, show two different perspectives of rural society and environment. Bain ignores all but the natural world even though he had been at work on the ice days before, and MacEachern focuses on work, community, and transportation. Yet they are connected, physically and emotionally, by the same seam of ice. They respect its power and study its movements together, knowing that it will soon uncover a warmer world of natural beauty and resources.
York Point, Prince Edward Island, 1866
“April 3, The body of ice in the harbour, agitated by the heavy north wind and full tide, broke loose from its mooring and swung down to the entrance. The broad reach of amethyste-blue water, gleaming with brilliant coruscations of light, and streaked with white lines of fome, look peculiarly striking and refreshing as an earnest of the onward march of approaching summer. Flocks of wild geese dot the chrystal borders of these beautiful lakes and repose quietly in the genial sunlight or dapple for their weedy meal in the clear bosom of the newly awakened waves.
This afternoon the ice broke off from our shore of the Elliot and drifted into the channel which was previously thawed open. In the evening I went down to the sandy beech [sic] thus suddenly exposed, to enjoy a walk among my old friends the shell-fish and sea-weeds. As I passed over the sive like patches of fine sand perforated by the pholades, but a very rare, faint squirt of water arose from the animals beneath where a shower of energetic spouts would have hailed me in the summer. I dug in the sand for some of the fish; they seemed near the surface. I sought in vain for whelks on the broad band of fine rippled sand, and also for the sandy mound of the buried natica. Here periwinkles were also very rare, and these very sluggish. Far out in the long sea-weed they were more abundant.”


